Kprobe & Uprobe - Linux Tracing
经过长期的发展, kprobes/uprobes 机制在事件(events)的基础上分别为内核态和用户态提供了追踪调试的功能, 这也构成了 tracepoint 机制的基础, 后期的很多工具, 比如 perf_events, ftrace 等都是在其基础上演化而来. 参考由 Brendan Gregg 提供的资料来看, kprobes/uprobes 在 Linux 动态追踪层面起到了基石的作用, 如下所示:
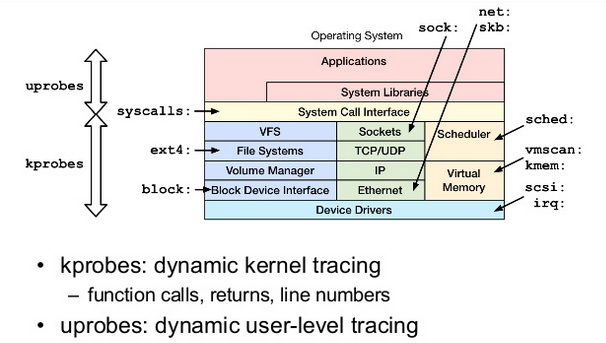
引用: https://blog.arstercz.com/introduction_to_linux_dynamic_tracing/
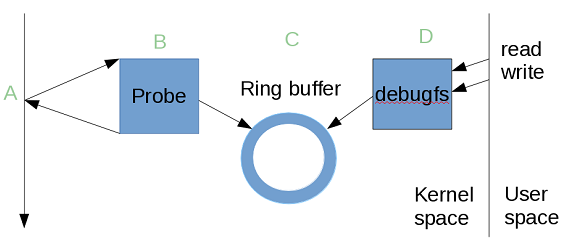
Kprobe 和 Uprobe 均可以通过 ftrace 的 /sys/debug/tracing interface (基于 debugfs 的用户空间层面的 API) 执行各种跟踪和分析,虽然 ftrace 的内部是复杂的, 不过输出的信息却以简单明了为主,更详细的使用示例可以参考 ftrace-lwn-365835, 如下图所示, 大致为 ftrace 的原理:
Krpobe 介绍
kprobe是linux内核的一个重要特性,是其他的内核调试工具(perf, systemtap)的“基础设施”,同时内核 BPF 也依赖 kprobe
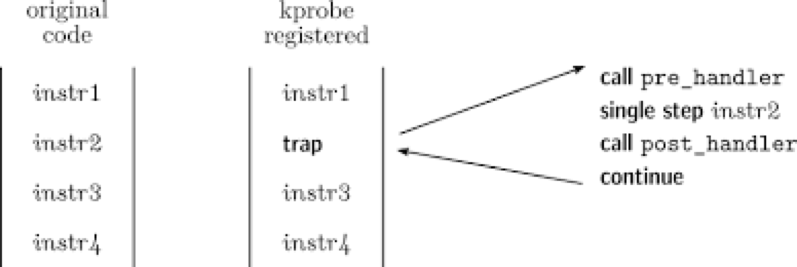
它利用指令桩原理,截获指令流,并在指令执行前后插入hook函数:
如果需要知道内核函数是否被调用、被调用上下文、入参以及返回值,比较简单的方法是加printk,但是效率低。
利用kprobe技术,用户可以自定义自己的回调函数,可以再几乎所有的函数中动态插入探测点。
当内核执行流程执行到指定的探测函数时,会调用该回调函数,用户即可收集所需的信息了,同时内核最后还会回到原本的正常执行流程。如果用户已经收集足够的信息,不再需要继续探测,则同样可以动态的移除探测点。
kprobes技术包括的2种探测手段分别时kprobe 和 kretprobe:
kprobe是最基本的探测方式,是实现后两种的基础,它可以在任意的位置放置探测点(就连函数内部的某条指令处也可以),它提供了探测点的调用前、调用后和内存访问出错3种回调方式,分别是pre_handler、post_handler和fault_handler,其中pre_handler函数将在被探测指令被执行前回调,post_handler会在被探测指令执行完毕后回调(注意不是被探测函数),fault_handler会在内存访问出错时被调用。
retprobe从名字种就可以看出其用途了,它同样基于kprobe实现,用于获取被探测函数的返回值。
基本使用指南
开启内核:
Symbol: FTRACE [=y]
Type  : boolean
Prompt: Tracers
  Location:
(5) -> Kernel hacking
  Defined at kernel/trace/Kconfig:132
  Depends on: TRACING_SUPPORT [=y]

Symbol: KPROBE_EVENT [=y]
Type  : boolean
Prompt: Enable kprobes-based dynamic events
  Location:
    -> Kernel hacking
(1)   -> Tracers (FTRACE [=y])
  Defined at kernel/trace/Kconfig:405
  Depends on: TRACING_SUPPORT [=y] && FTRACE [=y] && KPROBES [=y] && HAVE_REGS_AND_STACK_ACCESS_API [=y]
  Selects: TRACING [=y] && PROBE_EVENTS [=y]

Symbol: HAVE_KPROBES_ON_FTRACE [=y]
Type  : boolean
  Defined at arch/Kconfig:183
  Selected by: csky [=y]

Symbol: KPROBES_ON_FTRACE [=y]
Type  : boolean
  Defined at arch/Kconfig:79
  Depends on: KPROBES [=y] && HAVE_KPROBES_ON_FTRACE [=y] && DYNAMIC_FTRACE_WITH_REGS [=y]
终端运行:
首先通过 mount 获得 ftrace debug 接口,然后通过 kprobe_evets 注册你需要 probe 的内核函数,在 tracing/events/kprobes/
# mount -t debugfs nodev /sys/kernel/debug/

# echo 'p:myprobe _do_fork dfd=%a0 filename=%a1 flags=%a2 mode=+4($stack)' > /sys/kernel/debug/tracing/kprobe_events
# echo 'r:myretprobe _do_fork $retval' >> /sys/kernel/debug/tracing/kprobe_events

# echo 1 > /sys/kernel/debug/tracing/events/kprobes/myprobe/enable
# echo 1 > /sys/kernel/debug/tracing/events/kprobes/myretprobe/enable

# cat /sys/kernel/debug/tracing/trace
# tracer: nop
#
# entries-in-buffer/entries-written: 8/8 #P:1
#
# _-----=> irqs-off
# / _----=> need-resched
# | / _---=> hardirq/softirq
# || / _--=> preempt-depth
# ||| / delay
# TASK-PID CPU# |||| TIMESTAMP FUNCTION
# | | | |||| | |
swapper/0-1 [000] dn.. 2.488544: Unknown type 599
swapper/0-1 [000] dn.. 2.489270: Unknown type 600
sh-121 [000] d... 408.113780: myprobe: (_do_fork+0x0/0x3ac) dfd=0xbe485f20 filename=0x0 flags=0x0 mode=0x0
sh-121 [000] d... 408.117058: myretprobe: (sys_clone+0xa6/0xac <- _do_fork) arg1=0x82
sh-121 [000] d... 409.816850: myprobe: (_do_fork+0x0/0x3ac) dfd=0xbe485f20 filename=0x0 flags=0x0 mode=0x0
sh-121 [000] dn.. 409.817539: myretprobe: (sys_clone+0xa6/0xac <- _do_fork) arg1=0x83
sh-121 [000] d... 411.202079: myprobe: (_do_fork+0x0/0x3ac) dfd=0xbe485f20 filename=0x0 flags=0x0 mode=0x0
sh-121 [000] d... 411.202750: myretprobe: (sys_clone+0xa6/0xac <- _do_fork) arg1=0x84
社区 kprobe 文档非常完善:
https://www.kernel.org/doc/Documentation/kprobes.txt
https://lwn.net/Articles/410200/
Trace-cmd 和 kernelshark:
Trace-cmd 是一个基于 ftrace 的用户态前端命令行工具,它的仓库在:
git://git.kernel.org/pub/scm/linux/kernel/git/rostedt/trace-cmd.git
很多发行版,都有 trace-cmd 的包,完善的 man 手册
具体使用参考:
https://lwn.net/Articles/410200/
Uprobe
ftrace 基础使用:
先准备一个应用程序,测试代码:
#include <stdio.h>
#include <unistd.h>

static void
print_curr_state_one(void)
{
    printf("This is the print current state one function\n");
}


static void
print_curr_state_two(void)
{
    printf("This is the print current state two function\n");
}


int main() {
    while(1) {
        print_curr_state_one();
        sleep(1);
        print_curr_state_two();
    }
}
编译并获取可执行文件和反汇编 (9 系列请使用 riscv-linux-gcc):
➜  csky-linux-gcc test.c -o test
➜  linux-next git:(linux-next-ftrace-kprobe-uprobe-simlutate-insn) ✗ ../artifacts/output_860_next/images/host/bin/csky-linux-objdump -S test

00008518 :
    8518:       1422            subi       sp, sp, 8
    851a:       dd0e2000        st.w       r8, (sp, 0)
    851e:       ddee2001        st.w       r15, (sp, 0x4)
    8522:       6e3b            mov        r8, sp
    8524:       1006            lrw        r0, 0x8698      // 853c
    8526:       eae00007        jsri       0x0     // from address pool at 0x8540
    852a:       6c00            or         r0, r0
    852c:       6fa3            mov        sp, r8
    852e:       d9ee2001        ld.w       r15, (sp, 0x4)
    8532:       d90e2000        ld.w       r8, (sp, 0)
    8536:       1402            addi       sp, sp, 8
    8538:       783c            rts
    853a:       0000            .short  0x0000
    853c:       00008698        .long   0x00008698
    8540:       00000000        .long   0x00000000
00008544 :
    8544:       1422            subi       sp, sp, 8
    8546:       dd0e2000        st.w       r8, (sp, 0)
    854a:       ddee2001        st.w       r15, (sp, 0x4)
    854e:       6e3b            mov        r8, sp
    8550:       100d            lrw        r0, 0x86c8      // 8584
    8552:       eae0000e        jsri       0x0     // from address pool at 0x8588
    8556:       6c00            or         r0, r0
    8558:       6fa3            mov        sp, r8
    855a:       d9ee2001        ld.w       r15, (sp, 0x4)
    855e:       d90e2000        ld.w       r8, (sp, 0)
    8562:       1402            addi       sp, sp, 8
    8564:       783c            rts
        ...
00008568 :
    8568:       1422            subi       sp, sp, 8
    856a:       dd0e2000        st.w       r8, (sp, 0)
    856e:       ddee2001        st.w       r15, (sp, 0x4)
    8572:       6e3b            mov        r8, sp
    8574:       e3ffffd2        bsr        0x8518  // 8518
    8578:       3001            movi       r0, 1
    857a:       eae00006        jsri       0x0     // from address pool at 0x8590
    857e:       e3ffffe3        bsr        0x8544  // 8544
    8582:       07f9            br         0x8574  // 8574

➜  linux-next git:(linux-next-ftrace-kprobe-uprobe-simlutate-insn) ✗ ../artifacts/output_860_next/images/host/bin/csky-linux-readelf -S test
There are 28 section headers, starting at offset 0x1cd8:
Section Headers:
  [Nr] Name              Type            Addr     Off    Size   ES Flg Lk Inf Al
  [ 0]                   NULL            00000000 000000 000000 00      0   0  0
  [ 1] .interp           PROGBITS        00008134 000134 00000d 00   A  0   0  1
  [ 2] .note.ABI-tag     NOTE            00008144 000144 000020 00   A  0   0  4
  [ 3] .hash             HASH            00008164 000164 00003c 04   A  4   0  4
  [ 4] .dynsym           DYNSYM          000081a0 0001a0 0000a0 10   A  5   1  4
  [ 5] .dynstr           STRTAB          00008240 000240 000098 00   A  0   0  1
  [ 6] .gnu.version      VERSYM          000082d8 0002d8 000014 02   A  4   0  2
  [ 7] .gnu.version_r    VERNEED         000082ec 0002ec 000020 00   A  5   1  4
  [ 8] .rela.dyn         RELA            0000830c 00030c 00009c 0c   A  4   0  4
  [ 9] .init             PROGBITS        000083b0 0003b0 000030 00  AX  0   0 16
  [10] .text             PROGBITS        000083e0 0003e0 000282 00  AX  0   0 16
根据程序反汇编编插 uprobe 桩
echo 'p:enter_current_state_one /root/test:0x518 arg0=%a0 lr=%lr' >> \
/sys/kernel/debug/tracing/uprobe_events

echo 'r:exit_current_state_one /root/test:0x518 arg0=%a0' >> \
/sys/kernel/debug/tracing/uprobe_events

echo 'p:enter_current_state_two /root/test:0x544 arg0=%a0 lr=%lr' >> \
/sys/kernel/debug/tracing/uprobe_events

echo 'r:exit_current_state_two /root/test:0x544 arg0=%a0' >> \
/sys/kernel/debug/tracing/uprobe_events

echo 1 > /sys/kernel/debug/tracing/events/uprobes/enable

cat /sys/kernel/debug/tracing/trace
用户态任意位置都可以设置 uprobe 桩点
Perf probe 使用:
除了 ftrace,我们还可以使用 Perf probe -x 动态跟踪点是一种可观察性功能,可实现以下功能:甚至不需要重新编译就可以插装源代码的任意行。 有了程序源代码的副本,跟踪点可以在运行时放置在任何地方,并且每个变量的值都可以转储时间执行通过跟踪点。 这是一项非常强大的技术,用于检测其他人编写的复杂系统或代码。
perf probe -x /lib/libc.so.6 memcpy
perf record -e probe_libc:memcpy -aR ls
perf report
社区有大量 Uprobe 应用案例,和文档:
http://www.brendangregg.com/blog/2015-06-28/linux-ftrace-uprobe.html
https://www.kernel.org/doc/Documentation/trace/uprobetracer.txt
https://www.kernel.org/doc/html/latest/trace/uprobetracer.html